

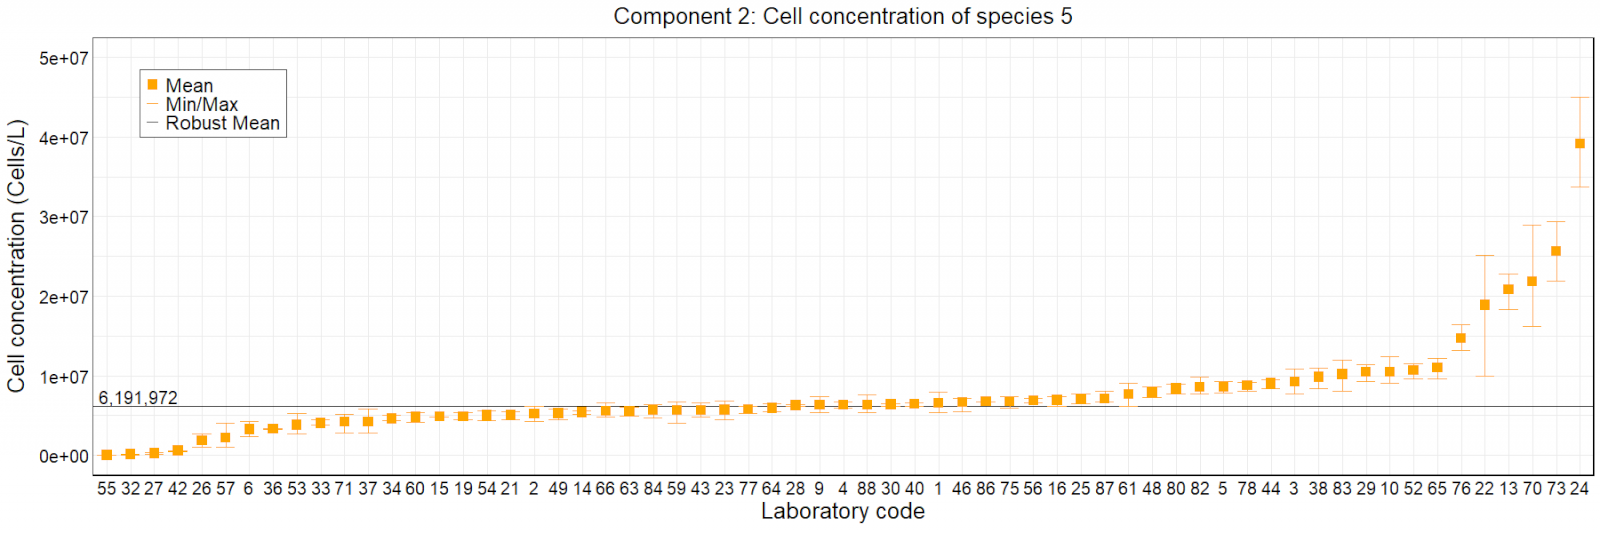
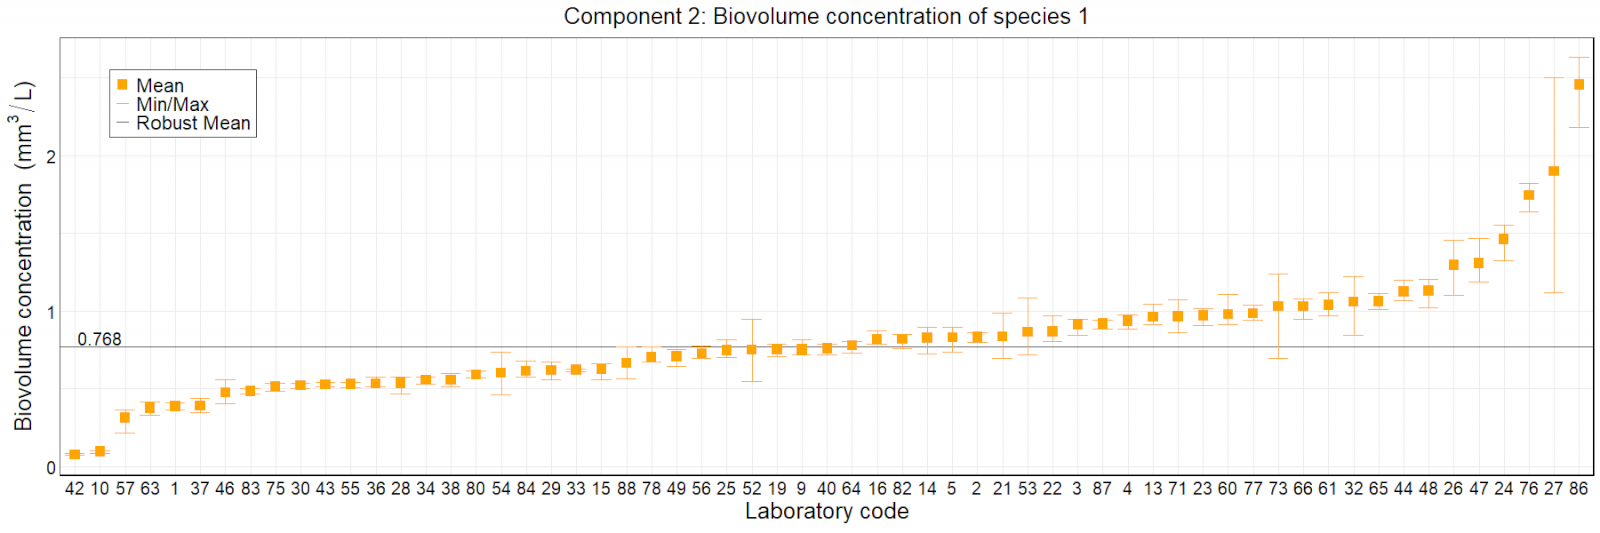
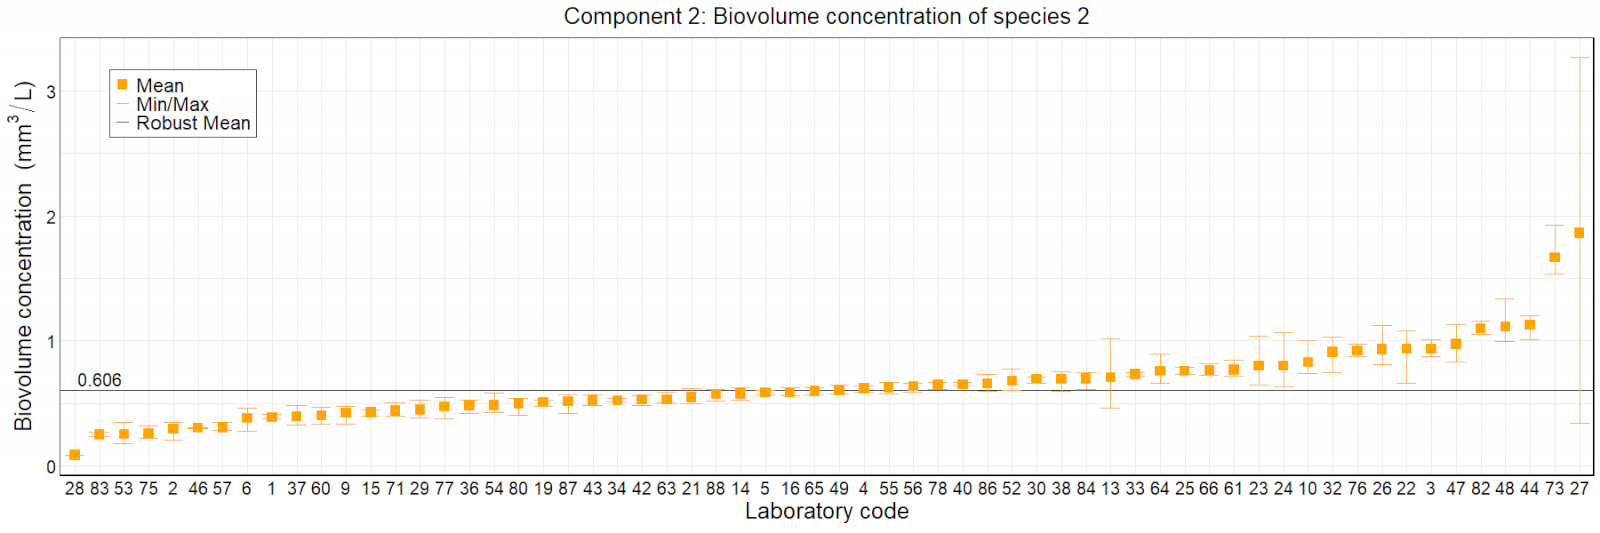
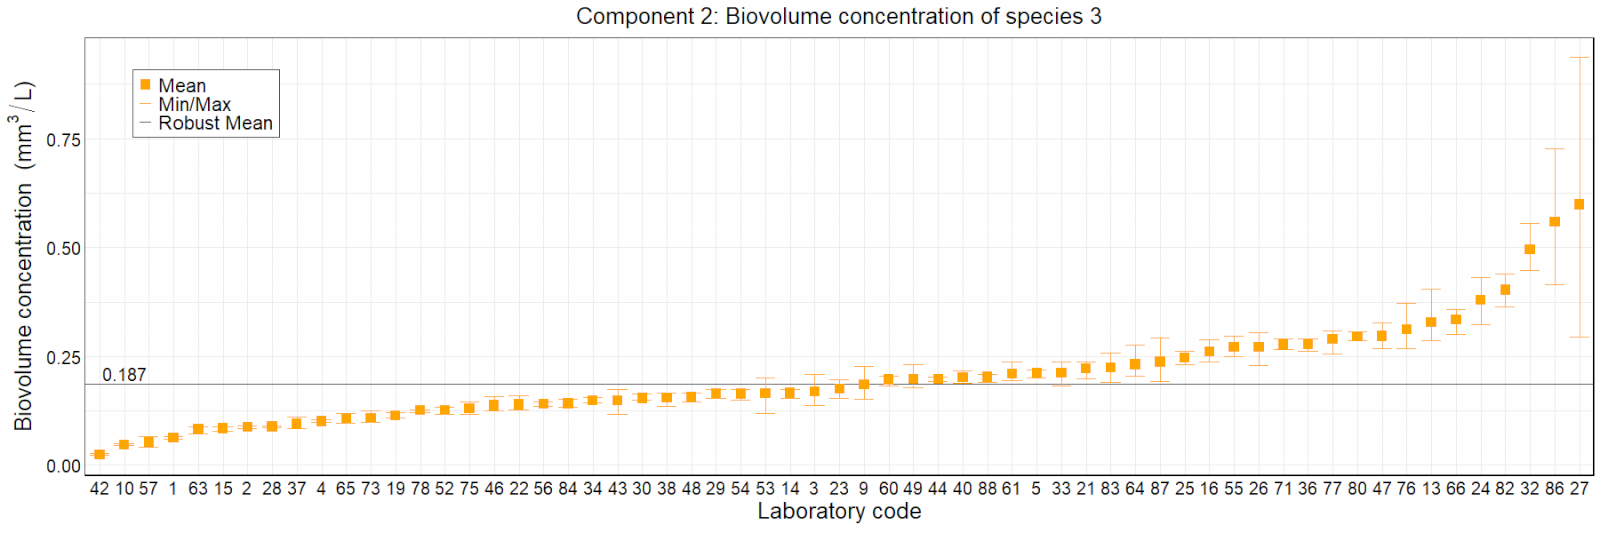
Sample: Natural phytoplankton sample
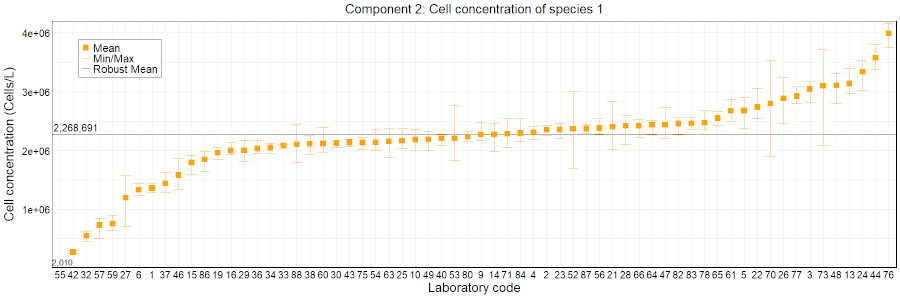
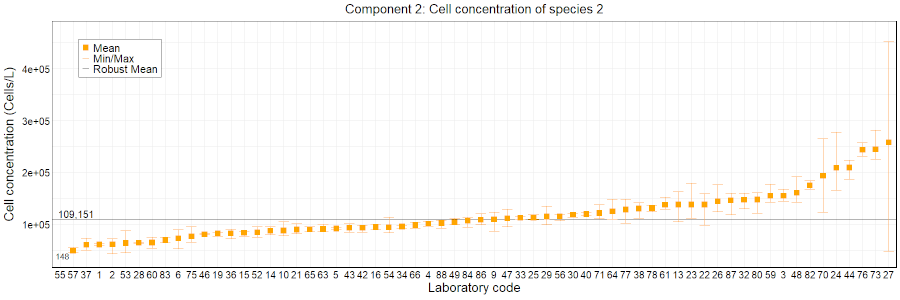
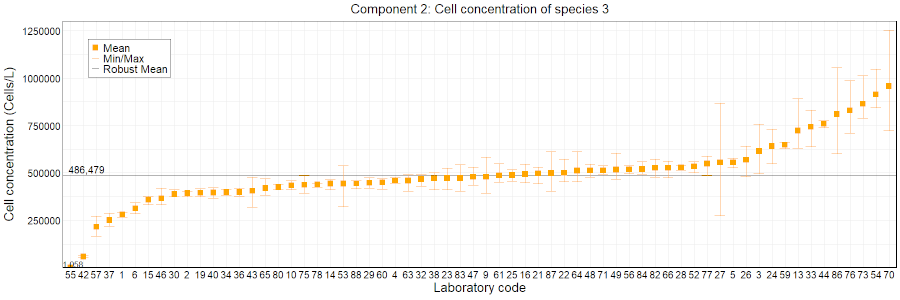
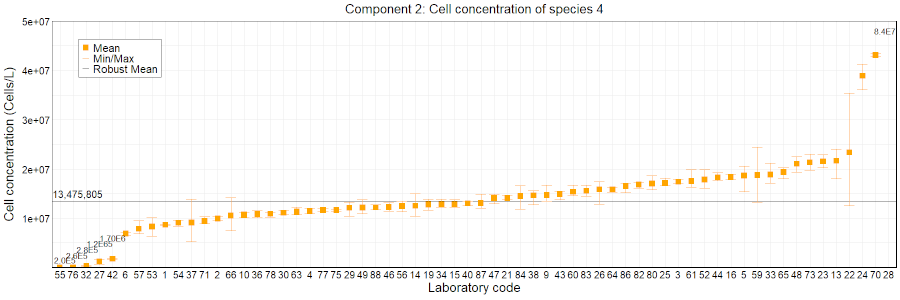
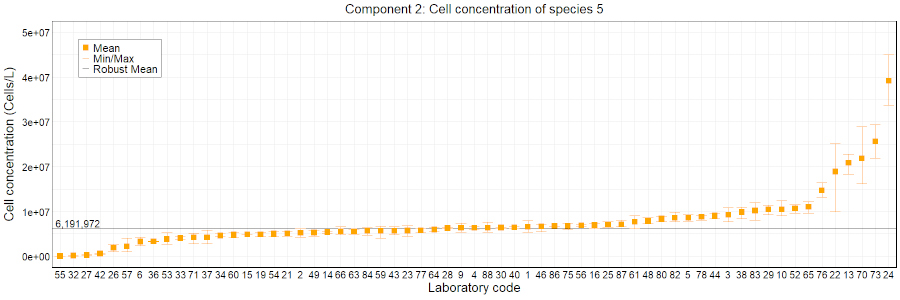
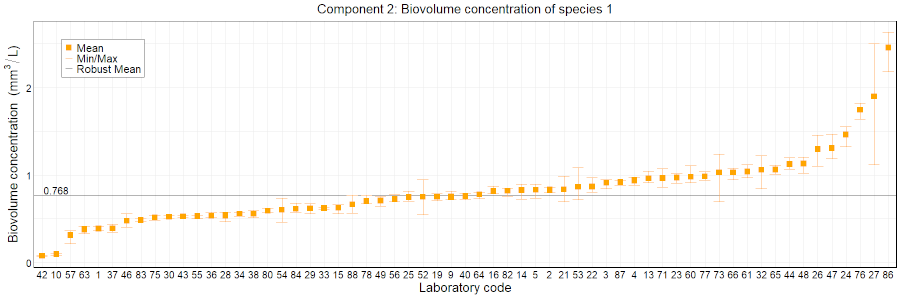
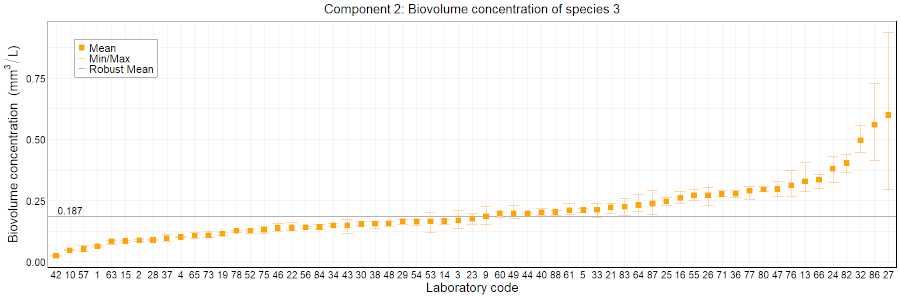
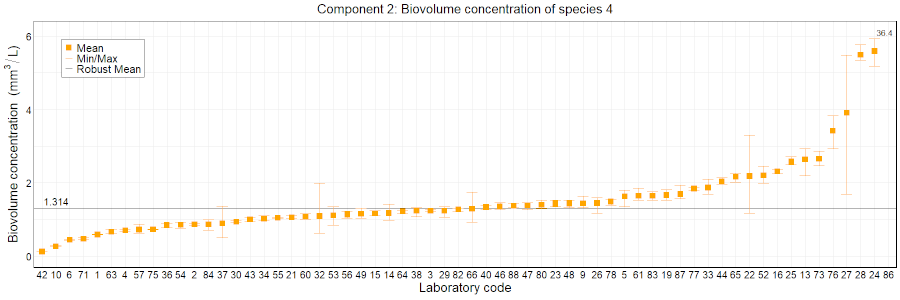
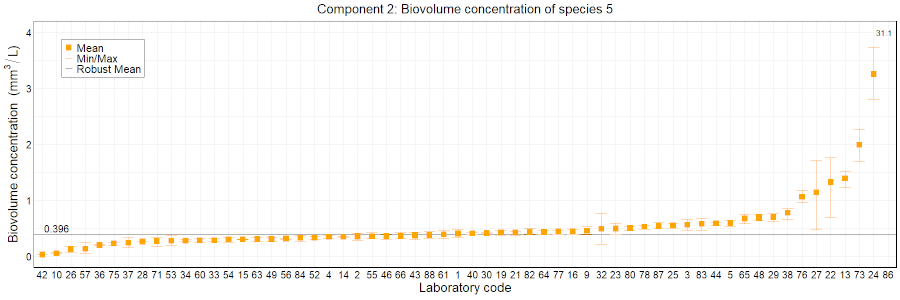
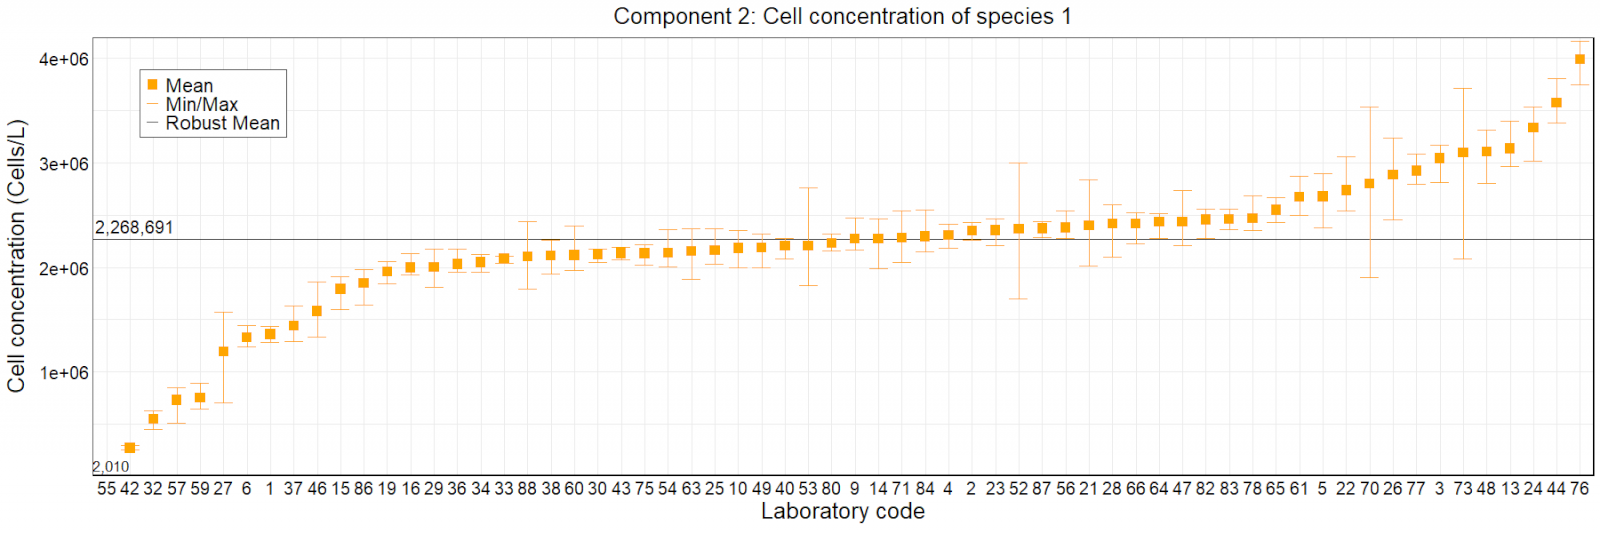
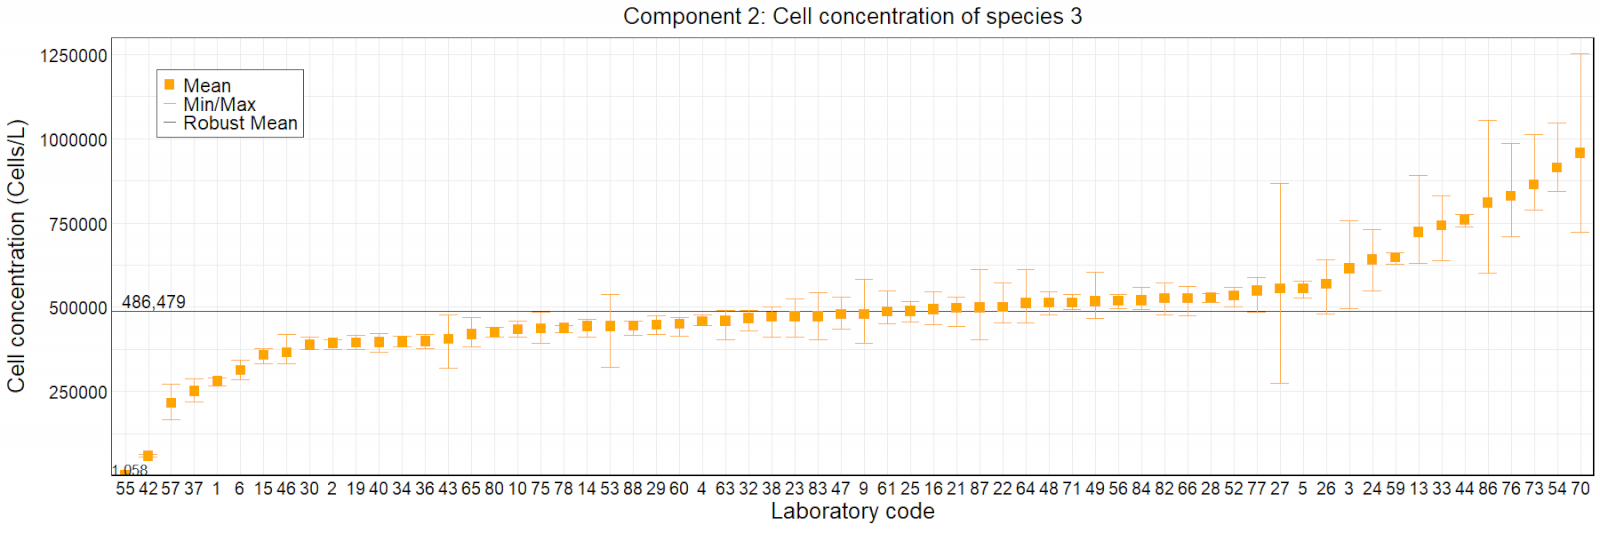
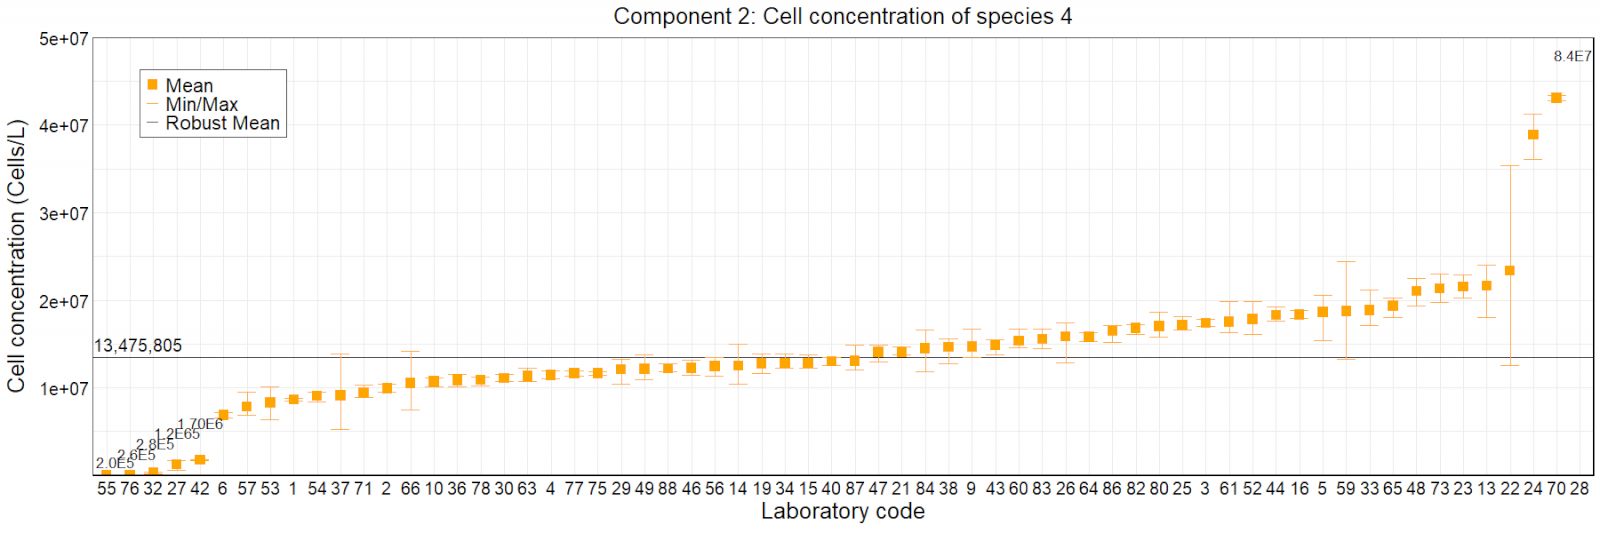
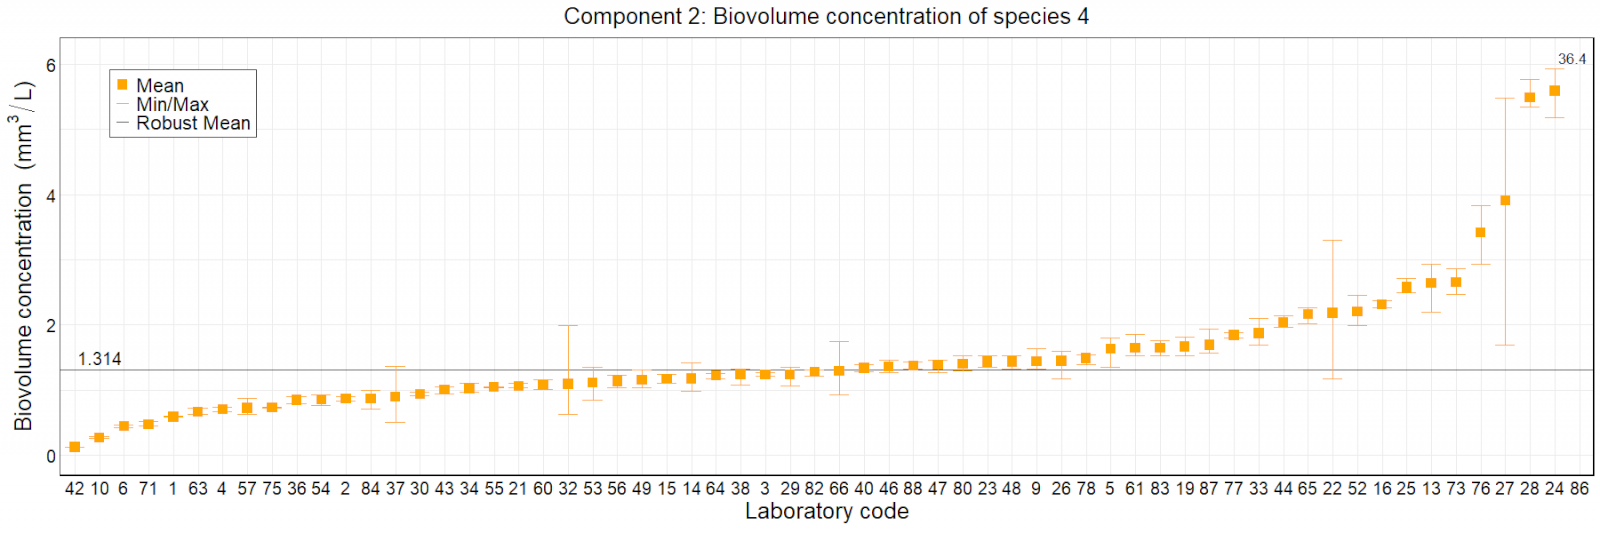
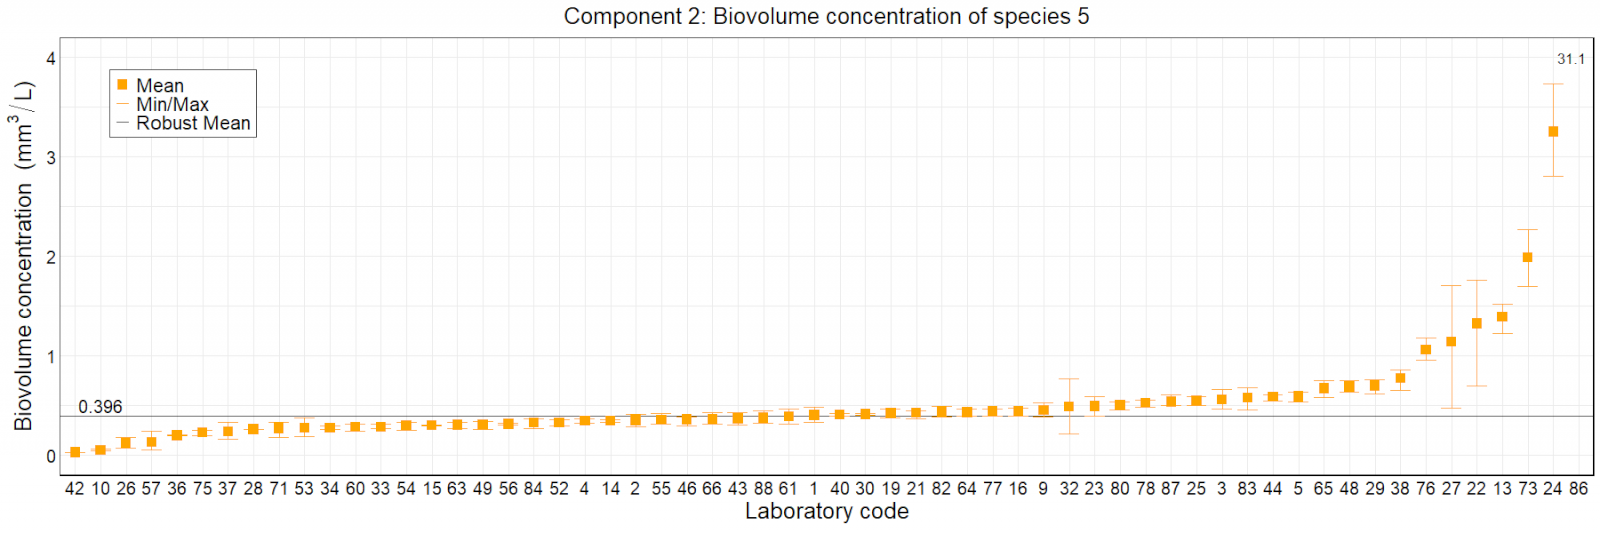
In the figures, we show the mean results for each laboratory as a small, orange box. Whiskers extend to the minimum and maximum values. The robust mean, based on the unfiltered data set, is presented as a bold black line. Mean laboratory results that lie out of scale have been entered as numbers.
The evaluation of the results follows DIN 38405 A45.